Follow Through/Leaders Chart

Thursday, February 28, 2008

Finally, some leadership

image

Leadership makes or breaks the market, and my indicator of market health is the IBD 100, which has started to show some strength. The percentage of stocks near buy points increased from 16 - 23%, and the heat map is showing better coloring (less red) since last Friday.

Wednesday, February 27, 2008

Reading recession in the S&P 500

0000@1109_1109-41265f5729111111

0001@1109_1109-41265f57295ceb24

News, economists, personal opinions are rarely in sync with markets. So it should be no surprise how the market can trend up when recession fears are at its worst. The S&P charts from today's IBD illustrate this well.

My 5 minutes of Fame

image

Had a nice chat with the Associated Press which turned into an news story about commodities investments. Thanks to KSDK channel 5 in St Louis for picking it up!


Rise In Many Commodities Draws Some Investors Looking For Short Or Long-Term Gains

Created: 2/26/2008 7:47:17 PM

Last updated: 2/26/2008 7:48:44 PM

NEW YORK (AP) -- With oil prices touching record highs in February, it's natural that some investors would want to jump into energy investments and others would recoil out of fear of a bubble.

Peter Kurata, an investor in Cypress, Calif., doesn't care which theory wins out; he relies on technical indicators to move in and out of investments and for now oil has an appealing sheen.

"It's very much in favor. I can't estimate how long it's going to run for but at least in the short-term it looks pretty good," he said. "I just follow where the leadership is and right now the commodity-related stocks are showing the leadership."

For investors looking to diversify their portfolios amid a pullback in stocks this year and who don't want to miss out on the ride in commodities, the answer might be to ease into some corners of the commodity market while keeping in mind that not everyone has to the stomach to be an oil prospector. The commodity markets are known for their volatility.

Kurata in mid-February invested in the PowerShares DB Commodity Index Tracking Fund, a Deutsche Bank index fund that lets investors draw returns from the commodity and currency markets. He's seen more than a 6 percent return.

He said he's not concerned that such sharp gains signal a bubble is building. Individual commodities investments make up 20 percent of his portfolio -- a larger percentage than many investment advisers might recommend -- and his style of investing is also more aggressive than that of many people. But his enthusiasm right now

for commodities such as gold, wheat and oil is shared by others.

"I'm pretty fluid with my investments. I can get in and get out once I see it's not working," Kurata said.

But even for investors who might shy from such a sizable commitment to commodities and the rigors of having to make fast-paced investment decisions as Kurata does, commodities can

maintain a reasonable portion of one's portfolio. But investors who might be fearful that some prices have gone too far, too fast

should be cautious.

Thomas Winmill, president of Midas Funds, said investors should consider an investment in a commodity like gold because of low interest rates and increases in inflation. He said investors should try to envision where demand might be in the coming months, not where it stands now.

"It's the old Wayne Gretzky move to try to figure out where the puck is going to go. I think in six months from now people are going to be talking about inflation and saying 'Gee, inflation is taking a whack out of my ability to buy stuff,"' Winmill said.

But investors should be ready for gyrations and, in most cases, have a long-term perspective. Winmill noted that while oil prices jumped 60 percent last year amid surging demand, zinc prices lost 40 percent.

Because many commodities are priced in dollars, a flagging greenback can also drive prices higher because it requires a greater number of weak dollars to buy a single barrel of oil, for

example.

"Take a diversified approach or a basket approach," he said, referring to investments that hold positions in several areas at once. "It's a volatile sector."

Winmill suggests most investors have about 5 percent of their holdings in commodities investments.

While some observers say demand for commodities will likely rise thanks in part to growth in countries like China and India, others are worried that a global economic slowdown could dampen demand.

Frank Holmes, chief executive and chief investment officer for U.S. Global Investors Inc., said the enormous growth in the world's

developing countries and what he described as a paltry investment in the infrastructure needed to obtain more resources makes it likely that many commodities will show long-term gains in prices.

To illustrate what he sees as seismic shifts taking place in the demand, he noted that in China and India, each person consumes an

average of two barrels of oil per year compared with an average of 25 barrels per person a year in the United States.

"And they're growing at 10 percent," Holmes said, referring to places like China.

Holmes notes that decisions by managers of big pensions and similar investments support a notion that long-term bets on commodities are not unwise even if prices soon recede.

The California Public Employees' Retirement System has said in recent months, for example, that it would step up its investments into areas including commodities.

"You're seeing each year pension fund groups are putting money into commodities but the average investor is not," Holmes said.

(Copyright 2008 by The Associated Press. All Rights Reserved.)

AP

Monday, February 25, 2008

Hornbeck Offshore Services (HOS)

image

image

After failing to breakout in January, HOS has built a new leg of its double bottom and regained the 50-day last week on huge volume. Another notable technical cue is the 4 tight weeks - a sign of support.

The market has yet to make up its mind

image 

The major indices ended up 1% on higher volume then seen in recent weeks, but still below average. Volume on up days has been edging up down volume, so this may suggest that the bears are wearing down and the bull are starting to wake up. Look for above average on the upside to confirm this. Glancing a the IBD100 heatmap shows that few stocks near buy points, and many that are still damaged.

Wednesday, February 20, 2008

This rally likely to fail

image

A distribution day 1 day after a confirmed rally spells trouble. Pages 10 and 11 of O'Neil's "How to Sell Stocks Short" talks about this, and in fact, discusses how this could be a possible shorting point. IBD's on studies confirm this as well.


Follow Through failure rate studies (presented at CANSLIM Masters Semimar). Distribution Day occurrences:

  • 1-3 days after FT on sames index- High failure rate
  • 4-5 days after FT on sames index- 50% failurerate
  • > 5 days after FT on sames index- decreases with more days

Gary Kautbaum's radio show, "Investor's Edge" mentioned that a 1 day dist day could be as high as 90%.

Thursday, February 14, 2008

A new rally begins

image

Volume was a bit light, but the 2.2% gain on the NAS did trigger a follow through signal. Tread with caution. Although FT's work 70-80% of the time, scale into positions and be on the look out for distribution days within the 5-8 next week to gauge this rally's strength.

Wednesday, February 13, 2008

My Latest Creation: The IBD 100 Heat Map

image

Read a couple books by John Boik last week; "Monster Stocks" and "How Legendary Traders Made Millions". A reoccurring theme was following the action of leading stocks. Jesse Livermore, Jack Bernard Baruch started this in the 1900's and O'Neil has carried this on. This inspired me to create a heat map of the IBD 100. This is a 20 week price chart. Colorings show a stocks price relative to new high, 50 and 200 day lines. Blue is good and red bad. Today's map is looking pretty good, and with the NAS up 2% on good volume, IBD may just call today a Follow Through!!

Monday, February 11, 2008

DBC- Worth a Look

image

image


O'Neil and his research team has not officially released how ETF's trade with CANSLIM rules, today's IBD featured DBC in the Exchange Traded Funds section, because it had all the great qualities of a CANSLIM stock. Flat base breakout on 2x average volume, record demand and price levels  for wheat and other commodities, and great relative strength compared to the major indices. In fact, according to the article, commodities are not directly correlated with the market, which makes DBC an attractive buy during this choppy, correcting environment. Here's DBC breakdown:

Crude oil 31.8%

Heating oil (18.69%)

Wheat (14.88%)

Corn (12.76%)

Aluminum (11.84%)

Gold (10%)

Thursday, February 7, 2008

Things To Do During A correction: Golf, Golf, Look for future Winners

image image image image

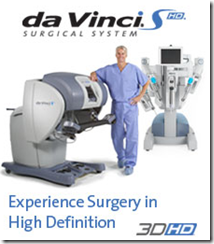
Today marks the 11th day of a rally attempt. The most successful attempts occur within 4-7 days and the longer the attempt, the longer this drags on, the less likely a follow through will hold. On the other hand, one never knows when the market will turn, so always be ready with a good list of picks. My "cream of the crop" scan came up with a few notables; Intuitive Surgical (ISRG), Hologic (HOLX), and China Medical (CMED) - all from the Medical Devices group. This confirms IBD's Industry Snapshot article "Good Medicine For Investors" from 2/4. We are an aging country, 12% over 65 and growing to 21% by 2050, and we're living longer. Medical equipment is rapidly advancing, entering into Star Trek type therapies. Using robots, high energy laser and ultrasound, and organ cloning. These new products bring value to what is currently on the market will help hospitals bring down skyrocketing costs. Confidence is evident by the rising level of venture capital money which is up 78% from 2005

Friday, February 1, 2008

When is a Follow-Through is not a Follow-Through?

image

Yesterday was a great day on the markets with the NAS, DOW, and NYSE all up over 1.7% on great volume. This should have been IBD's technical signal to begin a new market rally, BUT their stand remains unchanged. Here's why:

image

A 1.7% gain is usually a big gain relative to usual market action, but relative to today's volatility, we would need to see something more. Take a look a how January's price range measures up against past months.